logo mobile

Measurement & Reporting

How reporting works?

Data that tells the story your client wants to hear.

  • We place emphasis on the conversions and KPIs that matter to your client.  While we do report back on campaign metrics such as impressions, clicks, CTR, etc; we want to focus heavily on what matters.

Using Google Analytics and campaign pixel data, as well as foot traffic measures, we place a focus on results that are conversions first. 

Campaign Data: Fully Translated

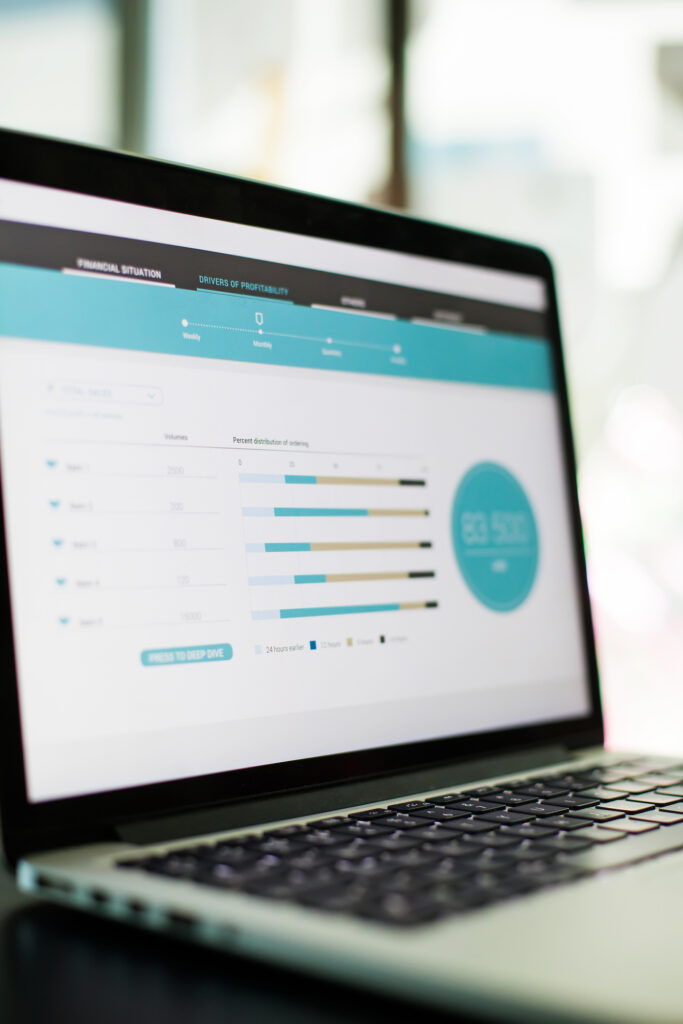
Different reporting dashboard options that are customizable to your client’s needs. Multiple formats in which analytical insights are shared.

  • Outside of recurring calls to discuss campaign reporting and insights, we provide text heavy reporting insights as well as video walkthroughs; where we show actual points of interest in the system and on the report with a narrative behind it.  Both are whitelabled and can be passed along to a client if needed.

Our core reporting tool: Google Analytics

At the core of all our campaign reporting, we are always looking at Google Analytics.

Analytics helps to show outside of campaign performance metrics (impressions, clicks, CTR etc) the effect that marketing has had on the website.

We strive to deliver insights and optimizations that take data from analytics across your whole website and provide attribution insights to campaign performance.

We report back on metrics such as paths to conversion, user demographics and behaviors, and much more to tell a compelling story of how campaign data is helping to improve overall traffic to the website.

Campaign Performance Notes Google Campaigns

Search Campaign

Top performing keyword is "job programs" generating over a 3% CTR and 2 phone calls. Other keywords that are slowly starting to gain search momentum: We feel these terms as well as others in the program that are more specific to the offerings of CMT will start to increase in search volumes as the campaigns continue to run. Seeing additional keywords begin to pop up is a result of brand awareness, which initial keyword research told us that awareness on terms related to CMT training was lower. This is why we placed a heavier emphasis on branding in the early stages of the campaign.

Display Campaign

Strong CTR across the display campaign; averaging .40% across both campaigns. Display industry average CTR is around .06%. This means that users are seeing your ads and interacting positively with them. The "in-market" targeted campaign is the top performing campaign with over 236k impressions served (or views of your ad creative), over 1353 clicks to the website. with an average .57% CTR.

General search and display campaign notes

sers who visit the website as a result of the Google Campaigns are split around 56% male and 44% female. Somerville has generated the highest volume of clicks so far across both campaigns.

Our core reporting tool: Google Analytics

At the core of all our campaign reporting, we are always looking at Google Analytics.

Analytics helps to show outside of campaign performance metrics (impressions, clicks, CTR etc) the effect that marketing has had on the website.

We strive to deliver insights and optimizations that take data from analytics across your whole website and provide attribution insights to campaign performance.

We report back on metrics such as paths to conversion, user demographics and behaviors, and much more to tell a compelling story of how campaign data is helping to improve overall traffic to the website.

Dashboard Access: Standart Dashboard

Standard Dashboard For All Clients- Agency and Non-Agency.

  • One login; all services
    • From the same login that is used for the order entry system, users can log in and access campaign performance metrics as well as view past orders and place new orders or change orders. 
  • Our standard dashboard can be accessed at any time to show real-time* data for all products and services (including spending if desired).
  • Logins can be created for both your internal team as well as for your individual client.
  • Reporting can be automated and scheduled here.
    • This reporting will not include insights, but at a moment’s notice, you can access up-to-date baseline campaign metrics.
  • The dashboard can be customized with your logo or your client’s logo to maintain it completely white-labeled.
  • The standard dashboard comes automatically with each campaign placed to run with Digital Analytics Pro. Logins are shared at the time the campaign launches, so there is never a delay in accessing real-time data.

Advanced Dashboard

Advanced Dashboard

  • Most often used with agency clients with spends north of $10k per month.
  • Using Google Data Studios, our team will build out a more advanced dashboard that can pull in data that does a deeper dive than the standard dashboard.

Pacing Reports

In addition to our dashboard where you can access real time data, our team will provide on a scheduled basis a pacing report that outlines optimizations we suggest or have made to the campaigns, spend, and how the programs are doing overall.

This type of reporting is standard for all clients, and is more commonly sent to non-agency level clients as part of a weekly check in, as this data can be found in their advanced dashboard
Pacing is designed to give your team a look into how we are managing the accounts, so you can answer any potential questions your client’s may have about how things are going & how things are being optimized.